Resources
The Public Edition of the GLEaMviz Simulator is available!
Download the GLEaMviz Simulator and explore your global epidemic simulations!
GLEaMviz project
 The GLEaMviz project covers the research conducted with GLEaM, the GLobal Epidemic and Mobility model that we developed in collaboration with the Center for Complex Networks and Systems Research at Indiana University, Bloomington, IN, USA. The GLEaMviz.org website reports on the progress of this project, its main results and the tools developed within this research direction.
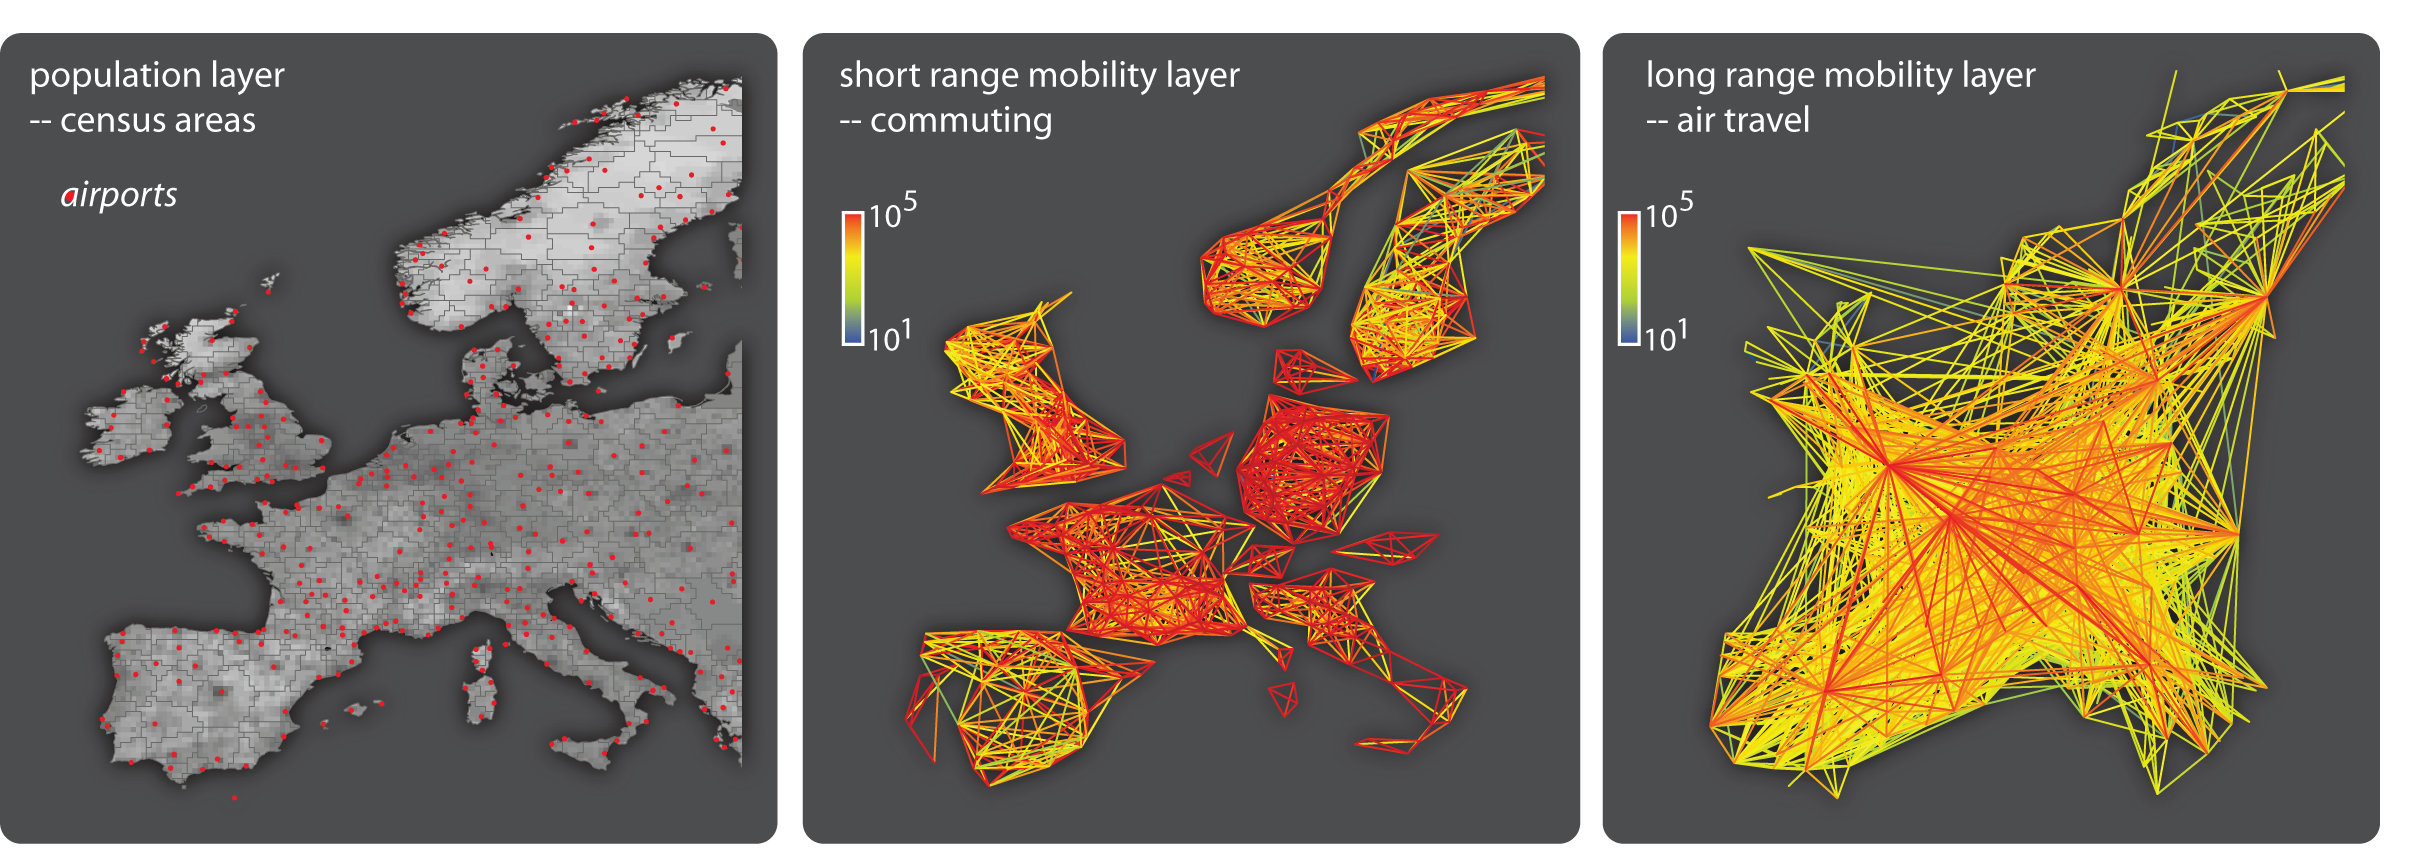
GLEaM integrates sociodemographic and population mobility data in a spatially structured stochastic disease approach to simulate the spread of epidemics at the worldwide scale. GLEaM is based on a meta-population approach in which the world is divided into geographical census areas. These areas are connected by human-travel fluxes that correspond to transportation infrastructures and mobility patterns, and that together form a network of interactions. The model is based on a highly detailed population database containing demographic data in census cells that cover the entire Earth’s surface in a grid of 15 × 15 minute squares. To this, we add information on the long-range airline fluxes of people travelling to and from the airports listed in the International Air Transport Authority (IATA) database. In addition to long-range air travel, GLEaM also incorporates short-range mobility patterns that correspond to ground movements and commuting patterns, based on data from more than 30 countries on five continents. The figures above show an extract of the three GLEaM layers centred in Europe. Read more about GLEaM.
Check out our research on the special focus on H1N1 influenza. You will find detailed reports on the evolution of the A(H1N1) pandemic and the predictions we made last summer on the incoming winter influenza wave.
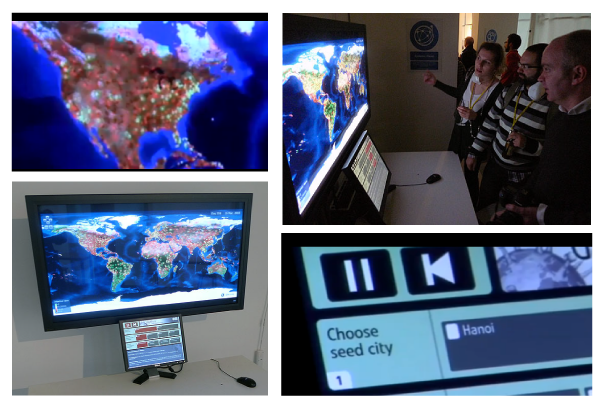
The animation above shows the predicted geotemporal evolution of the H1N1 flu pandemic in Europe for the Fall 2009, in the scenario where no intervention is considered. The map displays the daily new number of cases at a resolution level of ¼° with a color code ranging from yellow (low activity) to dark red (peak activity). The data mapped is obtained from the average value of the daily new number of cases calculated over 2,000 stochastic realizations of the model.
The timeline shown is from September 1, 2009 to December 31, 2009. On the right, the plot reports the corresponding incidence profile for Western Europe in the same time window. The shaded area corresponds to the 95% CI obtained from the simulations.
GLEaMviz Simulator
The GLEaMviz Simulator is a software system with an intuitive and flexible GUI for the simulation of emerging infectious diseases spreading across the world, that we developed during the last 2 years. The software system levers on GLEaM, and its design maximizes flexibility in the definition of the disease compartmental model and in the configuration of the simulation scenario, allowing the user to set a variety of parameters, from compartment-specific features, to transition values, to environmental effects. The output of the simulation is then provided in terms of a dynamic map visualization and sets of charts to quantitatively describe the geotemporal evolution of the disease.
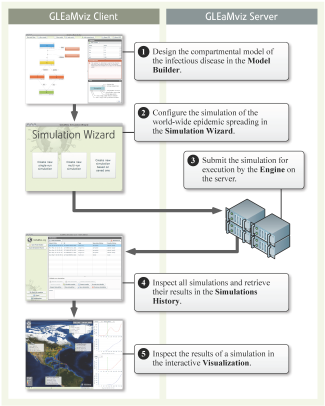
The software is based on a Client-server system. The Client can be installed on the user’s local machine, and it allows the user to setup the simulations that will be executed on the server, thus avoiding specific requirements for large computational capabilities on the user’s side. The Client consists of four principal components: 1) the main window with the Simulations History; 2) the Compartmental Model Builder; 3) the Simulation Wizard; and 4) the Visualization Windows. The main workflow and the role of the components are outlined in the diagram in the Figure above.
The GLEaMviz Simulator Client uses the Adobe AIR 1.5 runtime and can thus be installed on recent versions of the following operating systems: Windows, Mac OS X, Linux.
The Public Edition of the client available from http://www.gleamviz.org/simulator/ is pre-configured to use the GLEaMviz server made available by gleamviz.org. There is thus no need to install the server in order to use this client. However, in order to avoid an overload on this server, a number of limitations are enforced in this setup. Research groups interested in an unlimited version of the GLEaMviz system are invited to contact us at info@gleamviz.org.
Check out all the software features at the GLEaMviz Simulator webpage!
Epidemic Planet
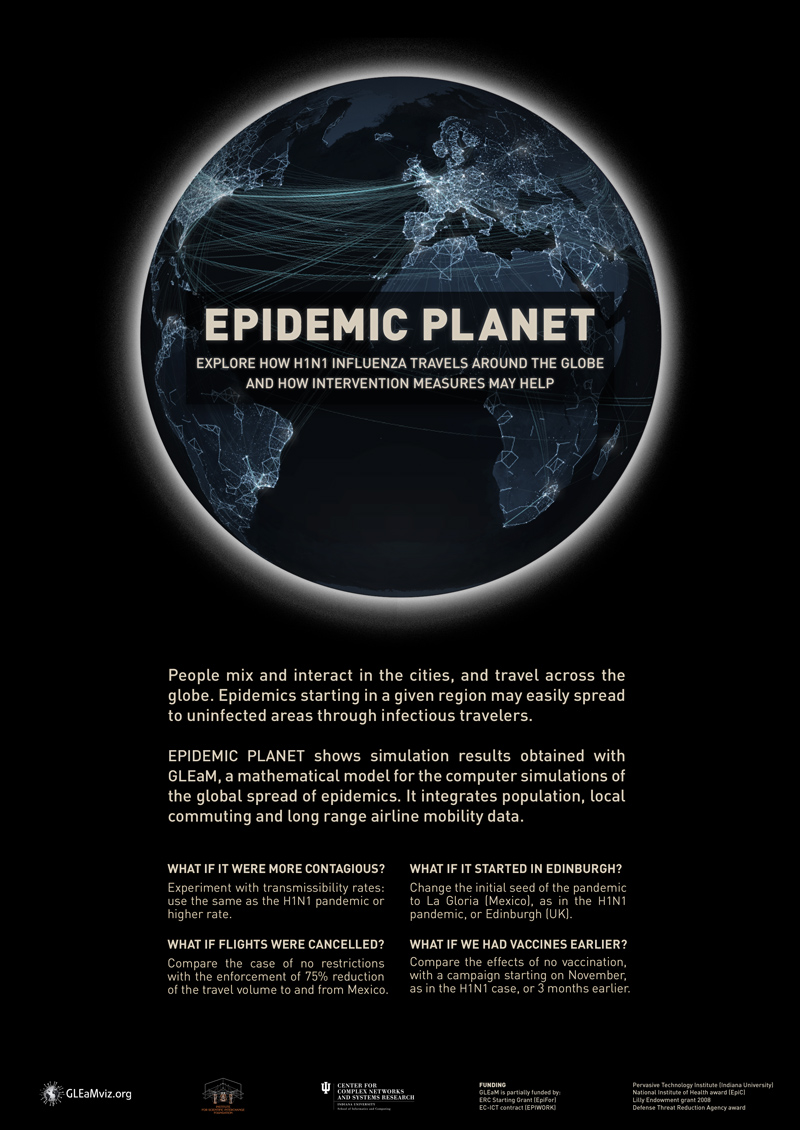 Epidemic Planet is the visualization application developed in the context of the GLEaMviz project, which enables its users to interactively compare and learn about the effects of a number of geographic and infection features, as well as intervention scenarios on a pandemic, simulated using GLEaM, the GLobal Epidemic and Mobility model.
Epidemic Planet has been conceived as an installation for scientific exhibitions meant to disseminate the long-running research based on GLEaM.
Its first public appearance was at the 3 months long INFECTIOUS Art & Science exhibition at the Science Gallery, Trinity College, Dublin, Ireland.
It will be featured in the Endinburgh International Science Festival, from April 3 to April 17, 2010.
Do you want to engage your public at your next scientific exhibition? Do you want to present how infectious diseases can be modeled and how new technology can be used for this purpose? Contact us!